CALCULATING...

Power 2026

Electricity Pricing in the Age of AI

CHAPTER 01

Preface: Motivation

AI is impacting every industry. But one of the least understood impacts is on our electricity markets.

Data centers have spun up to house the GPUs required by AI workloads, and the GPUs require power and cooling infrastructure. Many investors and entrepreneurs sense there's an opportunity, but lack the sophistication in either AI or power development to properly take advantage.

I'm a former quant researcher at a major hedge fund who covered power and gas, and these days I spend my time on machine learning research. That means that I hear a lot of opinions about data centers and I get a lot of questions. Many of these opinions are misinformed and questions misguided.

I received so much inbound that I started posting to TikTok and Instagram Reels about power pricing to educate people at scale, and people loved the content.

But that wasn't enough, because I wanted to reach more than the 22 year olds who browse TikTok. And even those young professionals wanted a more comprehensive resource.

By the end of this primer, you'll understand:

  • How power plants are built and financed
  • How to produce an estimate for the power price
  • How data centers will impact the US grid

Hopefully you find it timely and interesting. Let's get into it.

CHAPTER 02

Fundamentals of Commodities Pricing

Before we dive into power, you have to understand where it sits in the broader context. There are three major commodity categories: energy (e.g. power, crude oil, natural gas), agriculture, and metals. All commodities have some basic properties in common, which set them apart from other asset classes.

Equities vs. commodities

Equities and commodities are different from each other in two major ways.

First, a stock doesn't have any sort of forcing function collapsing the price to its fundamental value. A commodities contract, in comparison, has a fixed settlement date. On the settlement date, someone will come and physically buy or sell that tradeable commodity. If the corn is too expensive, they're not going to buy it. Prices must collapse to reality.

Second, the underlying companies that equities represent have various relationships with each other that are sometimes hard to untangle, such as contracts, shared customers, supply chains, and so forth. Commodities feed into each other in a much more straightforward way. A wellhead drilled into the ground results in some amount of crude oil and some amount of natural gas (mostly methane).[1] Crude oil is great because it can be shipped easily all over the world. Its global market means that prices abroad impact us here in the US, hence the widespread concern around the closure of the Strait of Hormuz. That crude oil has a market price, and refineries buy it to produce distillates: petroleum products like gasoline, diesel, and jet fuel. That's the same gasoline that you buy at the gas pump.

If a well produces almost no oil, we call it a dedicated gas well, and that's where the majority of domestic natural gas comes from. Natural gas cannot be shipped in its raw form so easily, but you can cool it and ship it in the form of liquefied natural gas (LNG). The prices for natural gas abroad have lately far exceeded the prices in the US, so we export as much as we can. As a result, natural gas prices abroad don't impact us here in the US as much in the short-term[2]. In a simplified sense, the natural gas we have here in the US is the supply that couldn't be physically exported[3]. Natural gas is consumed by some industrial use cases (e.g. chemical manufacturing), residential-commercial (e.g. heating your home), and power[4] - the focus of this primer.

The system balance equation

The commodities market has to "solve" in a particular way at each location:

Supply = Demand + Net Exports + Change in Storage[5]

Supply is the amount that the local merchants need to produce. Demand is how much is consumed at a specific location. Net exports are the units exported from a region minus whatever was imported. Change in storage is the quantity stored minus the amount drawn from storage. This equation must hold true at every location in the entire world. There are additional constraints:

  • You can only transfer so much supply from one point to another (only so many trucks/ships available, or a power line can only support so much transmission - more on this later)
  • You can't draw more from storage than you put in, and you can only store a maximum amount of supply at a given time

If you know basic economics, you'll understand that each of the above variables is a function of price. Price is the amount of money that consumers pay and suppliers receive. If price increases at a location, then it becomes economical to produce more supply there (less efficient producers can now serve the demand without losing money), and the local demand goes down. Of course, it'll also decrease net exports (if there were any at all) and incentivize more supply to come out of storage (if any exists). The price will change everywhere until the system "balances."

At any given time, all of the units that are sold, whether the "first" unit sold or the "last" one, are sold at the same price. You might think that if it's really cheap for a supplier to produce goods, maybe they'd try to charge a little less. But in a competitive market, you don't personally get to "pick" the price at which you sell. This is a critical assumption for how commodities pricing works. So what determines that market price?

If we were to produce 1 additional unit of supply after demand/storage/exports are met, we would pick the cheapest producer that is not at full capacity. The cost of producing that additional unit of supply is called the "marginal cost." In a competitive market, the market price that everyone sells at is exactly equal to that marginal cost. Note that if you're the producer who provided the last unit of supply, you make $0 of profit; the price is equal to your marginal cost. This property is called "marginal pricing"[6]. It will be extremely relevant for power pricing.

A simple justification for why this is true: Let's pretend like that marginal producer refuses to sell at their marginal cost. They're only willing to sell for higher. The issue is that the market is competitive. There's another supplier who's going to undercut that attempted market price. This will keep happening until the market price is exactly equal to the marginal cost of the cheapest producer that can offer the additional unit of the supply. If the price were lower, then it would be uneconomical for anyone to supply that unit.

Power is special

Power is injected into or withdrawn from the grid at physical "buses"[7]. These buses are numerous and are spread out within every city in the US. They're all connected via transmission lines.

To rewrite the equation above in electricity terms for a specific location, which could be a physical power bus, a whole city, or an entire state:

Generation = Power Consumption + Net Power Exports + Change in Storage + Losses

Generation is the electricity produced by power plants at that location, which we'll dive into later. You're probably already familiar with power consumption, since you consume power to turn on your lights.

Exports/transmission occurs over a physical power line. When you push power through it, it heats up. That heat means it loses a little bit of power along the way. The metal also expands when it's hot. The more power you push through, the hotter the line gets, and the more it expands. If the power line expands too much, the power line could droop too low and light a tree on fire. As a result, each transmission line comes with a "rating." That's the maximum amount of power that can be pushed through that line.

Storage, in this case, refers to batteries, pumped storage, compressed air, and so forth. Like I mentioned, losses occur when power is transmitted over a power line.

There's one last thing that makes power different from the other commodities. If I buy 1000 barrels of oil, I can literally take physical delivery of those barrels of oil. If I buy 1 megawatt-hour (MWh) of power on the market, that doesn't necessarily mean I can just go and plug 1000 GPUs into the wall and start consuming 1 MW for an hour.

That's because the power market has a central authority called the independent system operator (ISO). They take in all the bids from local utilities (load serving entities) and all the offers from local power plants, and they compute the efficient market price at each location, plus intended generation and flows. Then throughout the day, they tell each generator how much power they need to produce based on how much consumption they anticipate at each location. (In some regions, there is no ISO, but an entity called a balancing authority still ensures the grid stays stable.)

The reason we need the ISO is to keep the grid balanced. When you draw a ton of power from the grid, you lower its frequency.[8] The opposite holds true if you're pumping power in. But these generators are like $100M+ machines that are rotating at the exact speed to produce power at the right frequency (60 Hz). We'll talk more about that rotation later, but all you need to know right now is that if the frequency of the grid differs from the correct frequency, it can cause serious damage to the generators.

In extreme cases, if someone is really consuming too much power, the balancing authority will cut them off. Sometimes, people aren't even trying to screw up the grid, but there just isn't enough supply to meet demand, like if major generators go on outage, or if it's a really cold winter and everyone is consuming a lot of power. To spare the generators, we're forced to resort to brownouts or blackouts, where parts of the grid are cut off.

It might seem like as a generator, you're subject to the day-to-day whims of the ISO, who tells you exactly how much you're going to get paid. That said, there are a variety of ways to trade power and hedge a physical plant if you own one, which we'll get into. Most data center operators hedge in some way.

CHAPTER 03

The Power Plant

As I mentioned, the power price comes from the marginal cost to produce power. But where does that cost curve even come from? Introducing the power plant.

Reading the EIA-860

A power plant comprises one or more generators, sometimes called "units." Every generator has some capacity, which is the maximum amount of power it can produce. It's measured in megawatts (MW) for most units, or gigawatts for something like a nuclear plant. Nearly every power plant on the US grid greater than 1 MW can be found in the EIA-860[9], a document that the Energy Information Administration (EIA) puts together annually. Sometimes the EIA-860 isn't exactly right, but it's good enough to get started. You can just look up a power plant to find more detailed specs if you're not sure.

You've probably heard about solar plants and wind plants. You might even have a 5 kW solar unit on your home. Other types of generators are hydro, nuclear, natural gas (just called "gas" or "nat gas"), coal, and really inefficient units like oil/diesel. Remember that marginal cost is the cost of producing an additional 1 MWh of supply. The marginal cost for producing power is roughly ascending in the order that I listed the fuel sources, with possibly natural gas and coal switched depending on how efficient the unit is. When you rank generators by their marginal cost, that's sometimes called the "merit order."[10]

Whichever generator/unit produces the last MWh required to meet demand is called the "marginal unit." This is often a natural gas generator. In other words, the marginal cost of that natural gas generator ends up setting the local market price, in line with the marginal pricing concept we discussed previously. This pricing mechanism (a uniform clearing price auction[11]), where all units get paid the same price regardless of their cost, ensures that power plants are incentivized to produce power as cheaply as possible.

The EIA-860 also reports the efficiency of each natural gas (or coal) generator via the "heat rate." If we measure the capacity of a generator in megawatts, then the amount of power it produces over time is in megawatt-hours (MWh), i.e., the number of megawatts times the number of hours. Without getting into physics, the amount of "heat content" of a fuel source is measured in millions of British thermal units (MMBtu). The heat rate[12] is a simple conversion that tells you the MMBtu of fuel required for 1 MWh of power (MMBtu/MWh). If you have 1400 MMBtu of natural gas and a 7 heat rate unit (pretty typical efficiency), then that's enough to produce 200 MWh, e.g., 200 MW for 1 hour or 100 MW for 2 hours. Clearly, a lower heat rate is better.

How natural gas generators work

The basic mechanism behind a natural gas generator is that it compresses some air and then lights some natural gas on fire to produce a high-pressure, hot stream of gas.[13] The gas expands through a turbine, causing the turbine to spin. That process is called the Brayton cycle. The turbine is attached via a shaft to a part of the generator that also rotates, appropriately called a "rotor." The part that stays still is the "stator." That rotation is what generates electricity.

Most electricity is generated via some sort of rotation like this. Consider hydro power which rotates a turbine with water, or a nuclear plant that produces steam to rotate a turbine, and so forth. (Exceptions include photovoltaic cells.) The setup that I just described is called a simple cycle gas turbine (SCGT).

When the gas escapes from the SCGT, it's still hot. In fact, it's hot enough that we're able to use it to generate even more electricity. A heat recovery steam generator (HRSG) can be strapped to the top, which essentially boils water until it turns into steam - which is then run through a turbine again for a second rotation to generate power. That's called the Rankine cycle, and when you combine it with the Brayton cycle above, you get a combined cycle gas turbine[14] (CCGT). Of course, the effective heat rate for a CCGT is going to be lower than that of an SCGT.

Maybe the SCGT gets you to 300-400 MW, and the CCGT gets you to ~600 MW. Sometimes, if there's really a lot of demand for power, the operator might want to push even higher. That's where peaker units come in. These are separate, inefficient units that might even take oil, and they can push the plant's output to ~800 MW. Of course, the heat rate is way worse. Anyone sane is going to use their CCGT first if they can, and only if the power price is high enough, then they'll turn on their peakers.

Basic economics of the plant

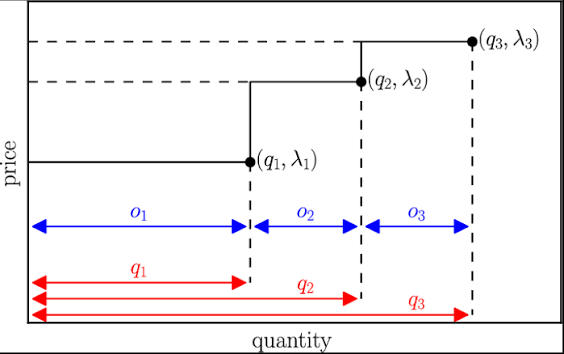
Power plant offer curve
Reproduced from N. Mazzi, J. Kazempour, and P. Pinson, "Price-Taker Offering Strategy in Electricity Pay-as-Bid Markets," IEEE Transactions on Power Systems, vol. 33, no. 2, pp. 2175–2183, 2018. (o1, o2, and o3 may refer to the capacities of three different units.)

This setup tells you quite a bit. You can probably imagine the turbine isn't immediately rotating at the right speed. You have to keep burning fuel for a little bit until it's ready. That's the "startup cost" for the generator, alongside whatever other costs the operator allocates (like labor or wear-and-tear). Since the operator deploys their units from most efficient to least efficient, the plant's offer curve is upward sloping. The cost to produce the next MWh of power depends on the heat rate of the unit and on the price per MMBtu of fuel. There are other subtle costs like carbon pricing in some regions, like California's cap-and-trade or the Regional Greenhouse Gas Initiative (RGGI) in the Northeast. The idea is that if you're a plant owner, you submit all of this info about your generator(s) to the ISO, and they'll figure out how much you're going to produce.

Operating a power plant isn't for the faint of heart. We're talking about 9-figures of equipment and complicated operational overhead. But depending on the region, a typical power price can be anywhere from $10-150/MWh, sometimes even more. For a 100 MW unit running at full capacity for 16 hours at $60/MWh, we're talking on the order of $100K of gross revenue per day (16 hours * $60/MWh * 100 MW).

Of course, that depends on the power price. But if you're running a data center, we'll talk about how you can lock some profit in.

CHAPTER 04

To Build A Power Plant

A power plant seems like a pretty sweet asset to own, especially with the rise of precipitous demand from AI use cases. So how do you build one? I'm going to give an overview of the major steps here:

Scoping/ambition

What type of plant is it? Natural gas/coal, renewable farm, nuclear plant? How big is it? Of course, each of these has its own construction cost and resulting cost structure. The larger the plant, the more expensive to build. If you use a particular fuel type, that constrains where you can possibly build the plant. For example, if you're doing a natural gas plant, you need to be near a natural gas pipeline, and you might have to build a branch pipeline to feed that gas to your unit.

What are you using it for? Do you plan to sell power into the grid? If so, be prepared to wait a long time. The interconnection queue is the line of people waiting to construct their generators at various locations. The ISO doesn't let them all construct at once, because they need time to appropriately plan and model the impact of adding that generator to the grid. For example, if a new plant is anticipated to cause tons of congestion, the ISO might need to build out more transmission.

If you're just going to use the plant for a data center, then you might opt for behind-the-meter (BTM) compute, which comes with challenges of its own. BTM is when you consume power generated on-site, so you can potentially simplify or avoid the generator interconnection process, but you need the space to put all of those GPU racks, cooling infrastructure, and batteries to balance your generation with your consumption.

Site selection

You've decided what kind of plant you want. But you can't just place it anywhere. I have people in my DMs asking me if their land is suitable for a data center or new plant. The answer is "usually no." Site selection is so constraining that you don't always have tons of options. You decide on the type of plant you want to build, then pick the site, not the other way around.

Besides the constraints mentioned above, what makes it so difficult? The biggest thing is conflicts. Let's say you're building a plant in Wyoming. You need to check for conflicts in oil & gas, trona, mines, mining claims, projects already in the queue. There are avoidance areas specified by the government (they're always protecting one animal or another). There's the Greater Sage Grouse Plan of 2025, which aims to protect a bird called the sage grouse. The bird takes priority over your power plant, so you ought to avoid it.

That sounds complicated, but all is not lost. There are Geographic Information System (GIS) files available for many regions online. You just need to look through the relevant GIS files to eliminate all of these possible conflicts.

Once you have some reasonable confidence that your area is deconflicted, now you want to get some stamps from someone else before you pull the trigger on buying land. If you're in somewhere like Washington state, they have an organization called Energy Facility Site Evaluation Council (EFSEC), which reviews all your materials and gives you an indication as to whether you're cleared of all conflicts. You'll likely engage legal counsel who is experienced in the region you're interested in to produce a third-party report.

Outsiders might assume that permits are just bureaucratic overhead, but even without permits, you'd have to be careful that you're not infringing on anyone's rights (land, water, air, and so forth). If anything, the permit is saving you a headache, because it's giving you confidence that you have the rights you think you have.

You might consider whether you're building in a friendly state. A huge number of states have sales tax exemptions if you're building a large enough data center. In Virginia, it's called the Data Center Retail Sales and Use Tax Exemption. Data centers create blue collar jobs, after all.

Tenants & Financing

You've picked where you want to build your natural gas plant for behind-the-meter compute. One problem. It's going to cost $300 million to build. Make sure you plan for the cash you'll need for GPUs, which can dominate the cost of constructing this whole thing.

You've applied for credit cards before, and maybe even a mortgage. But how do you get someone to underwrite $300 million of debt?

First, people often choose to buy the land using cash proceeds from an equity sale rather than debt. That gives you a bit of breathing room on the timing. The debt is used for the construction process, and you'll draw it as slowly as you can, because the interest payments can completely cripple your project.

But what are they even underwriting against? If you know anything about power, you know it's one of the most volatile assets in the world. No one wants to give a 9-figure loan to someone who has a 50:50 chance of making either $0 or $3 million next month.

You need some cash flow locked in. Maybe you're building a data center. For simplicity, we'll just call everything a long-term power purchase agreement (PPA), but the reality is that the contract might take various forms (energy services agreements, dedicated supply agreements, etc.). Your "anchor tenant," maybe a hyperscaler or AI lab, is going to commit to a particular price per MWh for some number of months - the longer the better. That future stream of cash flows is easier to underwrite against.

Let's say you're not a data center. You can still convert your volatile future stream of payments to a steady stream of consistent payments via what's called a heat rate call option[15] (HRCO). This is an instrument that is designed to mimic the economics of your power plant. If your power plant makes $50K one day, then in theory, exercising the HRCO should pay $50K. If your power plant didn't turn on at all, then the HRCO shouldn't pay anything. (In practice, the HRCO's economics mimic a theoretical plant that is an approximation of your actual plant's economics.) You sell this HRCO to a hedge fund who's pretty much going to exercise it whenever you turn on, so they're going to get all of your revenue. The good news? They pay you a fixed amount every single month (or day, or whatever cadence you're settling). That's the stream of cash flows you'll use to underwrite the construction loan.

Construction

At this point, an Engineering, Procurement, and Construction (EPC) contractor actually builds the plant. These guys will actually pour the concrete, install piping, and wire it all together.

The hard part right now is procurement. Many of the parts aren't readily available. Major turbine manufacturers like GE Vernova, Siemens Energy, and Mitsubishi Power are completely out of stock, with the backlog months to years out. People have been turning to more exotic sources for their parts. Jet turbines are being repurposed as gas turbines. Parts are being imported from China.

For data centers, you need a wired connection to the internet, a space to house the GPU racks themselves, and a process for handling cooling, water needs, and so forth.

Operation

Once your plant is built, you'll either operate it yourself or sell it to someone like an independent power producer (IPP). At this point, the revenue is more steady, so it's time to refinance. The construction loan interest rate is going to be much steeper than what you can get for a fully built plant.

At this point, you have your 9-figure power plant in operation. If you're a data center, you've hopefully locked in some fixed return. But what if you're the purchaser of a HRCO, or you're planning to sell into the wholesale market? Are you going to make money? That requires understanding the power price and how the independent system operator works.

CHAPTER 05

Case Study: Homer City Generating Station

Let's dive deeper into an actual example of a real-life power plant and make sense of its history and economics.

First of all, Homer City was historically a pretty big (2 GW) plant with three coal-fired units. It's located in Pennsylvania. That immediately tells you which power market the plant is in, which is called Pennsylvania-Jersey-Maryland (PJM). We'll talk more about that market later, but all you need to know is that coal has been way less economical than natural gas in that region. In this case, they were ~10 heat rate coal units, competing against 6 to 7 heat rate natural gas units. And as a result, the power plant had really been struggling. The ISO only dispatches the generators required to meet demand, and more efficient generators get dispatched first. So these coal units turned on less and less frequently. In 2023, after ~50 years of operation, the plant shut down.

But it's not the end of the road for Homer City. They're redoing the whole thing to build a 4.4 GW[16] natural gas plant. That is ginormous. A nuclear plant is already considered big at 1 GW. This 4.4 GW plant is intended to cost ~$10 billion to construct, and the plan is to turn it into a big data center campus.

It's a natural gas plant, so they secured EQT Corporation as their natural gas partner. That's been announced. They haven't announced the anchor tenants, which could be for a few reasons. It's not really in their interest to do so; if they're still working on financing, then no need to give your anchor tenants extra leverage. If they're still finalizing permits, they don't want to run into a situation that negatively impacts their customer (e.g. a fictitious headline like "Google's Planned Data Center Stalls to a Halt with Permitting Hurdle"). Even if they've already secured financing and permits, they might want to let their customers announce that on their own.

From what it looks like, Homer City has secured the major permits they need. The major one was an air quality permit that the Pennsylvania Department of Environmental Protection (DEP) approved in November 2025. Of course, they also needed a waterway permit. They have 1000 people[17] actively working on constructing this plant.

What's ahead for Homer City? What people speculate on is whether there will be delays. The natural gas units are going to be extremely efficient, around 6 heat rate. That's considered very good. Once it's constructed they'll probably refinance, and all-in, it has the ingredients of a highly profitable project. Of course, when there's this much money on the line, things have to go perfectly, or the consequences are expensive.

CHAPTER 06

Power Markets in the United States

If you're a trader, you're not going to be grabbing a shovel and building a power plant (usually). You want to understand the major markets and what makes each of them distinctive.

The first thing to know is the rules of the specific ISO you're trading in. Like I mentioned, the ISO is the entity that receives everyone's offer curves and the load-serving entities' anticipated demand, and they run a big optimization to solve for the efficient power price. We're going to dive into what that optimization actually looks like in a case study. But for now, you need to know that the optimization itself is a little bit different from ISO to ISO.

Within each ISO, there are a number of zones. The power grid consists of thousands of physical nodes that have their own prices. But most traders don't trade those individual buses. Instead, they'll trade what are essentially averages of those buses over a region, called a "zone." The exact averaging methodology varies.

If you're trying to apply this knowledge to your own electricity prices at home, note that you're not paying the wholesale price. The wholesale price is something close to the price of generation. The retail price is the wholesale price plus transmission/distribution, plus whatever overhead the utility company has. Those extra costs can constitute a large share of your total bill, even the majority. They're fixed costs that are shared by everyone consuming power on the grid.

Let's dive into the major markets:

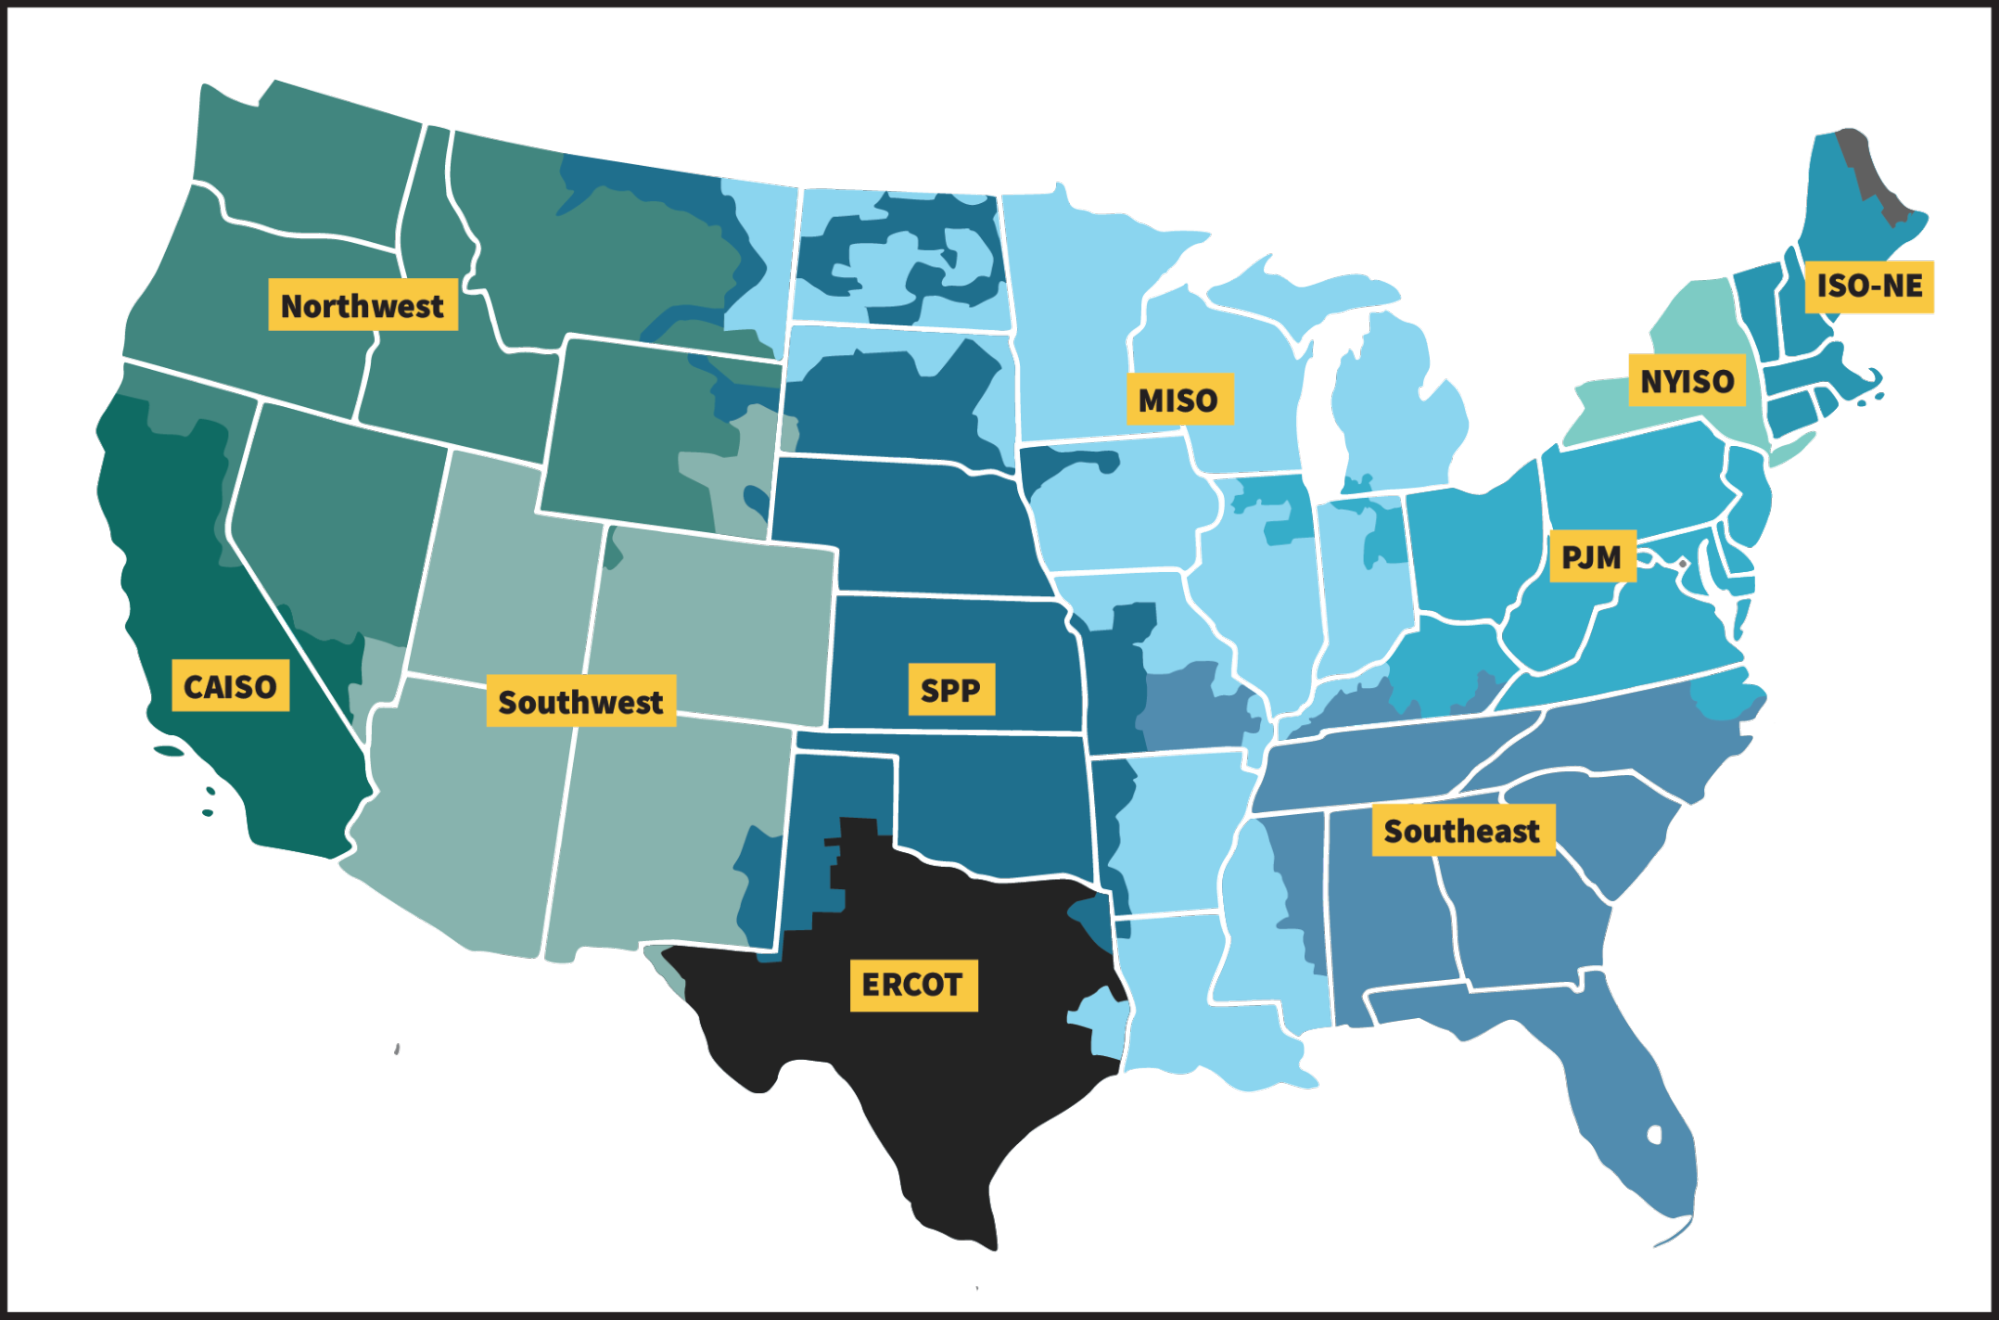
ISO map
ISO map from FERC

Pennsylvania-Jersey-Maryland (PJM)

If you had to blindly guess what market a random power trader operates in, PJM is the safest bet. This is the OG, the most liquid market. Confusingly, this market covers more than just Pennsylvania, New Jersey, and Maryland. If you're looking closely, you'll find that part of Illinois is randomly in PJM, along with Kentucky, Michigan, and others. You might hear a lot about Virginia in discussions of data centers; it's the data center capital of the US.

South of PJM are places like Georgia, Florida, and so forth. None of those regions have organized wholesale markets. They're operated by regulated utility companies that basically charge a fixed margin on top of their costs. If that sounds nice to you, I'm not going to lecture you, but note that there's not much incentive for anyone to cut costs in that regime, since they make a fixed margin no matter what.

Midcontinent Independent System Operator (MISO)

MISO is directly bordering PJM, so there are flows between the two regions. One of the major events happening in MISO is coal retirements in favor of renewables. Historically, coal was the marginal unit in MISO. You might think of coal as pretty dirty and crippled by carbon taxes, but a recent May 2026 report[18] from EIA points out that MISO coal units have been more profitable than natural gas units in recent years. MISO is known for its large wind generation.

Indiana, Illinois, and Michigan in particular have been popular choices for new data center developments.

California Independent System Operator (CAISO)

CAISO, my home! CAISO is split into North Path 15 (NP-15) and South Path 15 (SP-15), connected via a big transmission line called Path 15. There's also a small region you might hear about in central California called ZP-26, which sometimes makes sense to break out since that's where the Diablo Canyon nuclear plant is. But it's no longer a heavily traded product in comparison to NP-15 or SP-15.

There are a bunch of distinctive features about California. For one, as you can imagine in this state, we're pretty renewables-forward. That means there's no coal. As a result, you can really think of it as just renewables (including solar/wind), nuclear, and natural gas. Second, there's been fast renewables growth fueled by subsidies. Some of this isn't directly visible to a trader since it's behind-the-meter solar panels, which serve household demand before it hits the grid.

NP-15 imports as much as it can from the Pacific Northwest, which is not an ISO. The generators in the PNW receive a fixed rate of return (similar to south of PJM). They have a ton of hydro power.

Monterey Park, California, was the first to ban data centers outright via ballot measure[19]. (A statewide attempt in Maine was vetoed.)

Electric Reliability Council of Texas (ERCOT)

ERCOT is a legendary market. Fabled stories of $9000/MWh power prices. A "deregulated" grid that is separated from the rest of the US. Prices that go negative due to excessive wind generation. What does it all mean?

First, you have to understand the US grid topology. There's the Western Interconnection and the Eastern Interconnection. These are effectively like two separate grids within the US. There are some limited flows between the two grids (in the form of HVDC rather than AC), but they don't operate as one "electric machine." Then there's a third grid in the US: Texas. Just like the Western vs. Eastern Interconnection, there are some limited HVDC flows that can transport ~1 GW between Texas and the rest of the free world. But it's effectively isolated.

That isolation buys it some freedom. Most of the US is regulated by the Federal Energy Regulatory Commission (FERC). Texas can operate on its own rules. The main way that plays out is the way it handles inefficient supply. We're going to explore the ramifications of that policy in a case study next section.

The excessive wind power in North and West Texas sometimes even drives the price negative. You'd figure a wind turbine would shut down under those conditions, but a combination of startup/shutdown costs plus subsidies (like the Production Tax Credit[20]) means the wind generators continue operating even to -$20/MWh. There ironically isn't enough demand to meet supply. That means you literally get paid for every unit of power that you consume. It's like a restaurant that pays you for the food you eat there. That's made those regions popular picks for tenants who need to purchase huge quantities of power, like data centers (and historically, Bitcoin mines).

Other Markets

There's the Southwest Power Pool (SPP) known for wind; New York ISO with its distinctive Manhattan demand sink and upstate nuclear power that can't reach it; ISO New England where there's not enough natural gas to go around in the winter, forcing them to resort to oil. I'd go into it all, but the reality is that no short summary will do all these regions justice. The best resource for a comprehensive overview is the online ISO materials themselves.

CHAPTER 07

Case Study: Alberta

Let's dive deep into one ISO so you can really see how market structure decisions have massive ramifications. I thought about picking California, since its renewables growth has its unique challenges. I also considered Texas, since the energy-only pricing policy has had notable, public failures. There's an interesting market that has both of these features, but it's not in the United States.

Alberta is sometimes referred to as the "Texas of Canada." For one, it's natural gas heavy. In the US, if someone asks you what the natural gas price is, you'll refer to the price in Henry Hub, Louisiana, because that's the most common trading hub here. If someone asks you in Canada, you'd give the Alberta Energy Company (AECO) price. Since there's so much natural gas, of course they're going to use that for power.

The most Texan part of Alberta is the way that it handles inefficient supply. So remember from marginal cost pricing, the clearing price is the cost of producing the last unit of power. That's great if you were one of the cheapest suppliers. If you're a solar plant, that's practically pure profit. But what if you're literally the least efficient supplier on the grid? The vast majority of the time, the ISO isn't going to call you to turn on. You're simply too inefficient. But once in a blue moon when you do turn on, you'll get paid the marginal cost of the last generator required to turn on… which is you. You'll make exactly $0 of profit. That means you should probably shut down. And when you do, the next least efficient supplier will shut down too, by the same reasoning. Soon we'll have no suppliers left.

The way California, PJM, and most organized markets in the US handle this issue is some form of a market for existence. That's a periodic payment that we pay to generators for the service of literally existing. You can think of it as insurance. If we ever need them to come online, then they'll be there (and we'll pay them for the power they produce, too). You can go and purchase "capacity" from units on the grid. In California, that takes the form of resource adequacy requirements, where local utility companies like PG&E are required to go and negotiate with generators to pay them enough to stay alive. In PJM, it's called a "capacity market" operated by the ISO itself.

Texas and Alberta think that's a little bit inefficient, and it's not hard to see why. You're paying these generators periodically, maybe even for years, and they get paid to do nothing. Is there a way to make this more of an efficient market, so the market can just figure out whether they should exist?

The proposed solution is called an "energy-only market," a market design that does not incentivize the existence of generators outside of the price they're paid to produce power. Texas starts with the observation that a blackout is a bad event, and collectively as a society we don't want it to happen. A blackout, when power is totally cut off, or brownout, when voltage is decreased, occurs when there is some amount of unmet demand. Energy-only markets aim to incentivize reliability through the power price alone.

The classic example is Texas, which assigns a dollar value to every unit of unmet demand during a blackout ($5000/MWh). That seemingly high price might be reasonable, since if something like a hospital doesn't get that unit of power, people can die. Power is not always optional, and many models assume the demand to be inelastic. The next step is to construct a "probability of lost load." The closer the grid is to running low on supply, the higher that probability gets. Finally, we add the price per unit unmet demand times the probability of lost load to each megawatt-hour that's served. In effect, during hours where power is scarce, the generators all get paid a "price adder" on top of the normal power price. That price adder ensures that it's economical to produce power even for the least efficient generators. Of course, if a blackout occurs, that probability is going to hit the ceiling, and power prices can approach the $5000/MWh offer cap.

Alberta does not have price adders like Texas, but it is still an energy-only market. Note that generators have fixed costs they need to cover, and they require some rate of return to underwrite their construction, which marginal cost pricing does not provide. This is called the "missing money" problem. Alberta solves this by allowing plants to receive an excess from their marginal cost, called a "scarcity rent." The only caveat is that Alberta does cap the maximum price at C$1000/MWh, slated to increase in the coming years[21]. That means that if your marginal cost is higher than that, you better find other sources of revenue, or else it's time to shut down.

But this is also Canada. They have aggressive renewables growth. In fact, the renewables penetration is so deep that the daytime price can go to its $0 price floor. It's not economical to run CCGTs all day, because during the daytime the market price is way below your marginal cost. But we still need natural gas units in the evening, when people come home and turn on their TVs, their ovens, their lights. If you look at the "net demand" curve (demand minus renewables), then you'll find it's very low in the daytime and high in the evening. The exact same phenomenon has been occurring in California due to its high renewables growth, which CAISO calls the "duck curve."

That results in this weird phenomenon where we're forced to use the less efficient SCGTs in the evening because they're cheap to start up and shut down. The end result is that the difference between the daytime versus the evening price in Alberta has been getting higher and higher as renewables growth increases. As opposed to power plants, which only sell power, batteries are able to both purchase and sell power. Batteries have begun to flatten Alberta's price curve, since they buy the cheap daytime power price and help meet the demand in the evening.

The combination of these factors means that the Alberta market has undergone discussions to aggressively restructure; the restructuring is underway.

CHAPTER 08

The Production Cost Model

In various ISO planning documents, you'll find reference to a "production cost model."[22] The production cost model is used by the ISO to determine exactly how much power each generator should produce.

Unfortunately, some of them don't publish the exact formulation, and the setup varies. You can find some exact formulations[23] online.

Theoretical underpinnings

The production cost model selects the generators that minimize the total cost of production. That might sound obvious to you. But economically, minimizing the cost to produce goods doesn't always result in the "best" market price. In this section, I'm going to explain why this model is theoretically sound for power.

At a high-level, we start with the assumption that power demand is "inelastic" across all consumers. No matter who it is, we pretend like people are willing to pay any named price for power. That's not exactly right, and you might be familiar with programs like demand response (DR) where you can get paid if you curtail your demand during critical hours. But let's stick with a simplified model for the purposes of this primer.

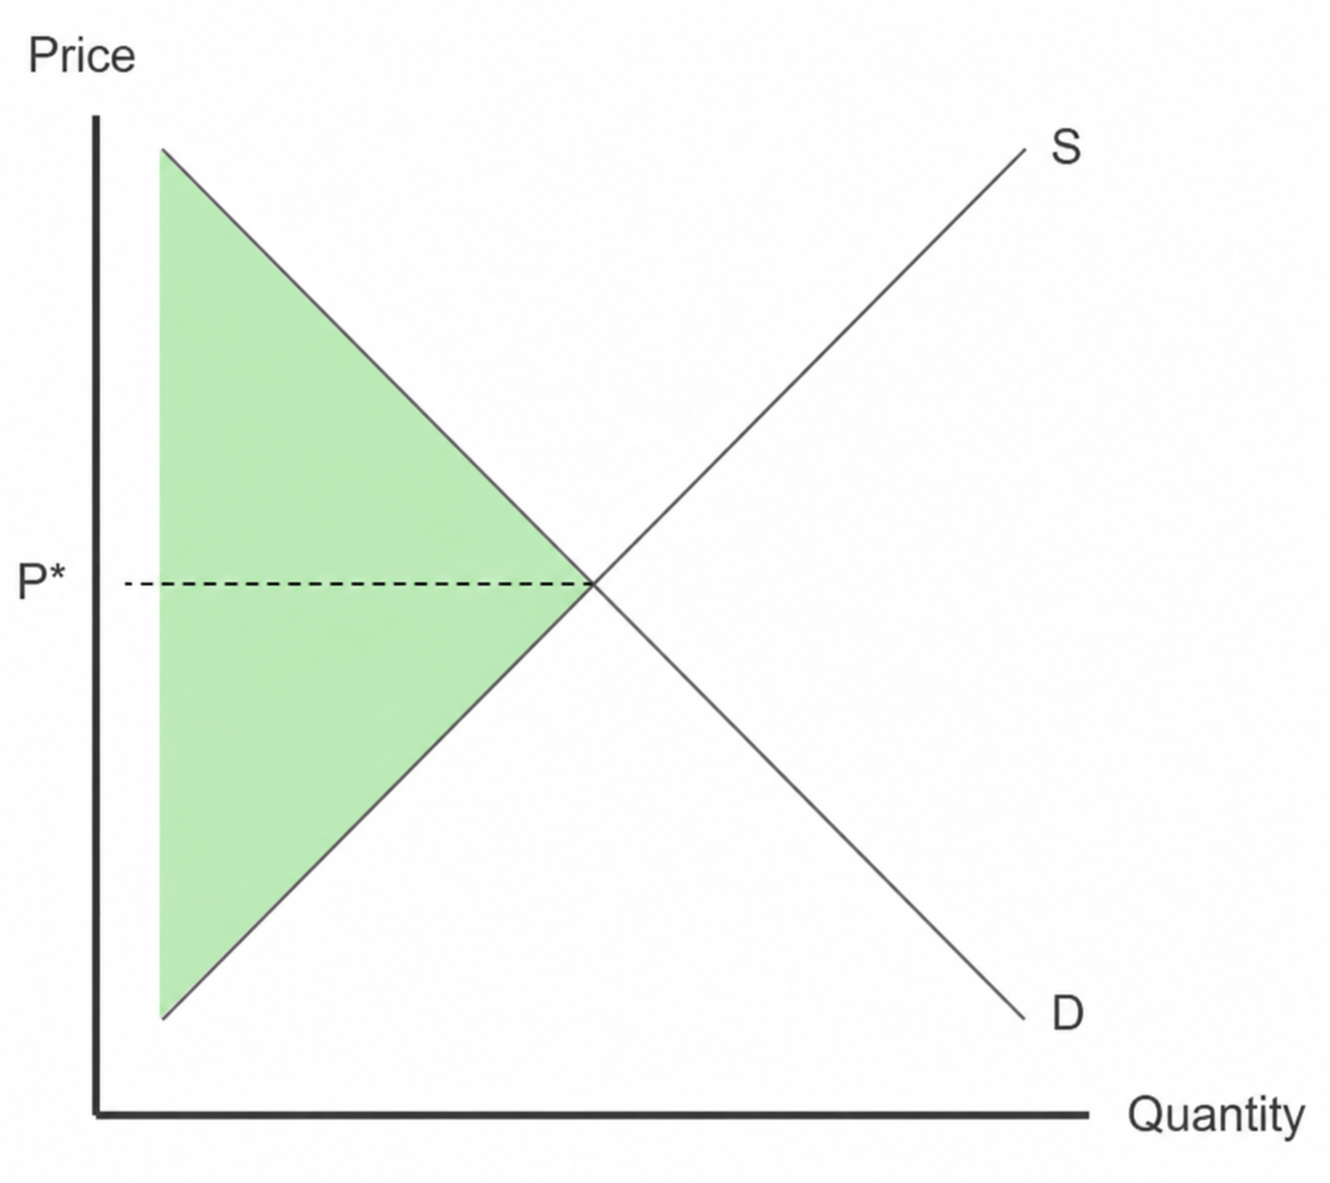
As a society, we want as many people to benefit from a market as possible. We quantify that with the concept of "welfare." Welfare is when you're getting a good deal. If you bought an item at $5 but you really valued it as $15, that's $15 - $5 = $10 of welfare. If a producer has a marginal cost of $4 but they're able to sell a good at $7, that's $7 - $4 = $3 of welfare. In theory, the efficient market price is the price that maximizes total welfare, which is visually the area between the supply and demand curves, up to the point where they intersect:

Supply and demand chart
Typical Supply & Demand Chart. P* is the efficient market price.

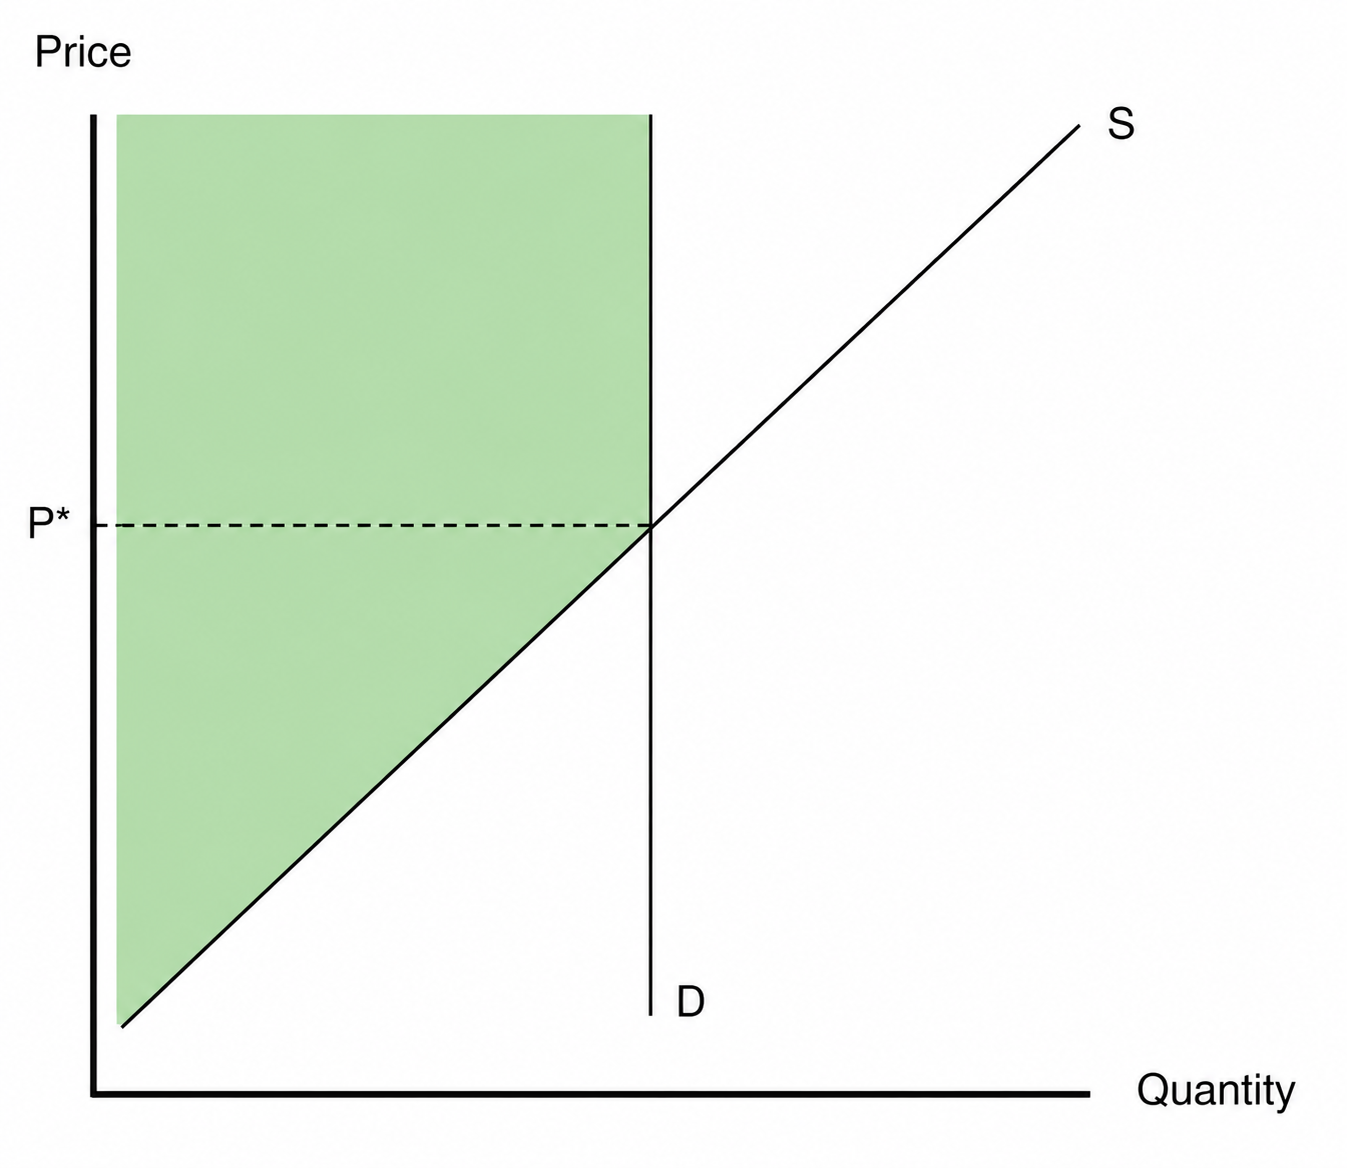
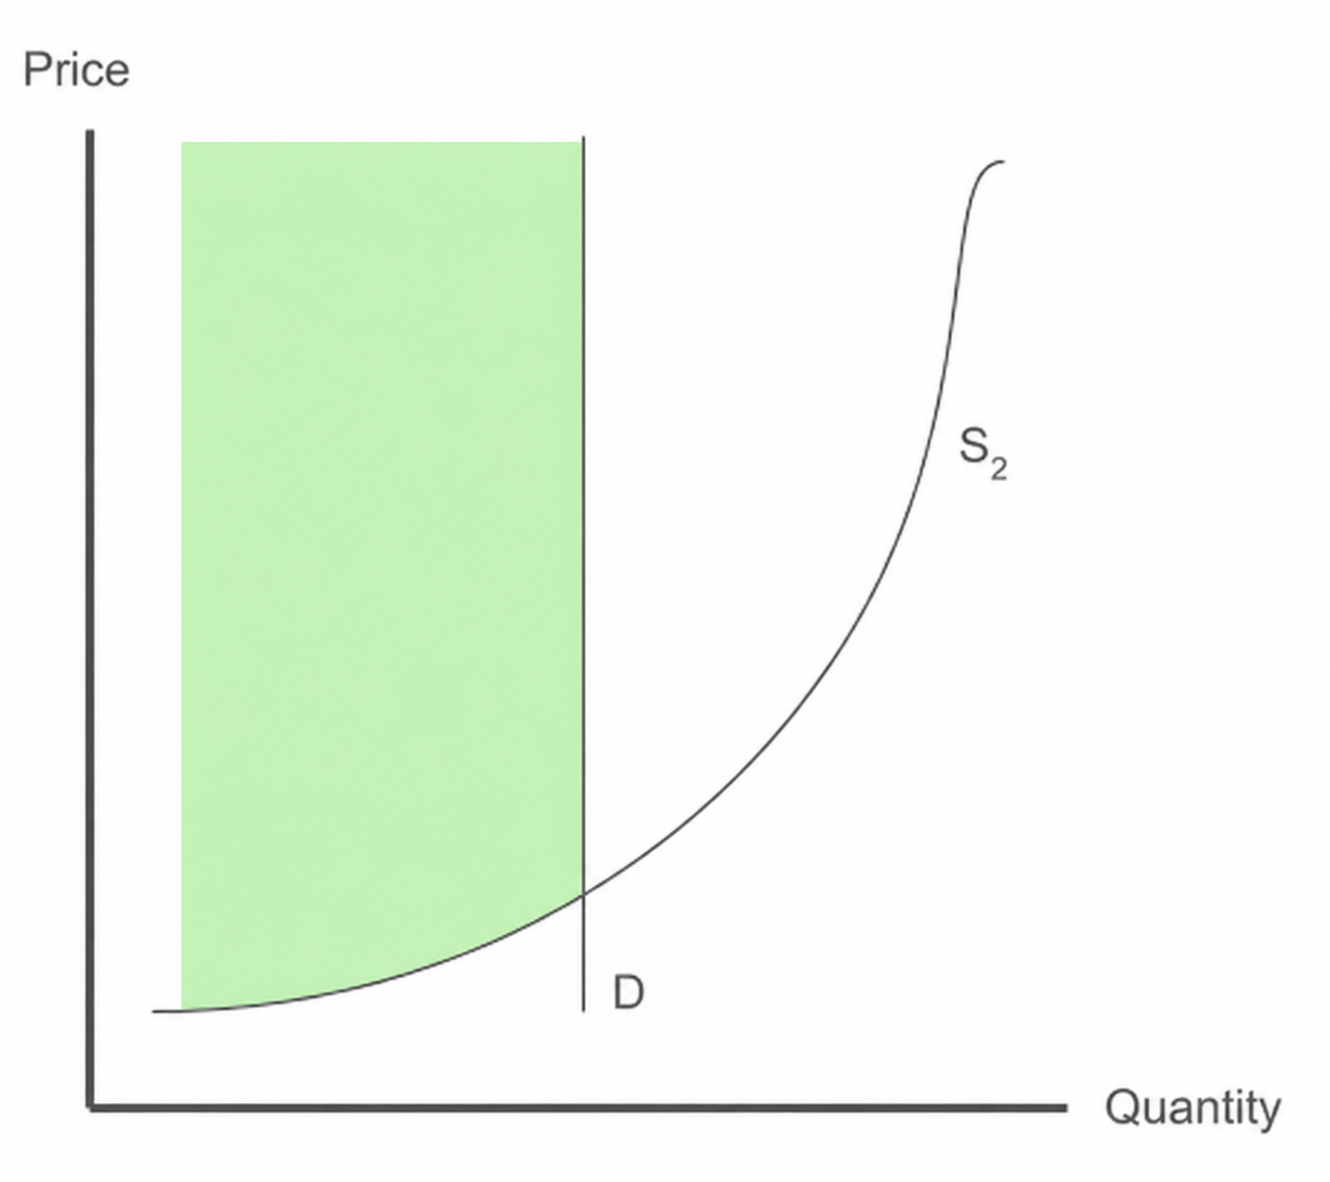
The supply and demand curve above looks pretty typical. But what happens as the value of power demanded goes arbitrarily high (i.e. inelasticity)? The curve D becomes steeper and steeper, until the quantity demanded remains the same no matter the price.

Inelastic demand
D is close to a vertical line when demand is inelastic.

If D is practically a vertical line, the only other knob to maximize the area is to make the supply curve as low as we can:

Optimized supply curve
S2 is a "better" supply curve than before.

In other words, we want to select the generators that result in the lowest total cost of production. Is there an existing tool to solve this sort of problem? In optimization theory, we are able to find the minimum of a function subject to a set of constraints. We define the production cost model as the following:

minimize total_system_cost
subject to:
  • Balance constraints: supply equals demand at each location[24]
  • Transmission constraints: the power sent via a transmission line stays within its rating
  • Generator capacity constraints: the amount produced by a generator is between 0 MW and its capacity
  • Reliability constraints: various other constraints that the ISO encodes (e.g. reliability reserves)

Optimization problems like this can be solved using software like Gurobi or CPLEX. The model outputs the amount that each generator must produce. That's why it's called a "production cost" model. The total system cost is the sum of all the generators' costs (including startup costs, marginal costs, everything) plus any losses incurred by transporting power through the transmission lines.

We've discussed earlier how the "price" at a location is the marginal cost of producing an additional unit of supply at that location. Reaching into the toolbox of optimization theory, each constraint in the optimization problem has a property called its "Lagrange multiplier." The Lagrange multiplier of each location's balance constraint is exactly the marginal cost for providing an additional MWh of power at that location.[25] It comes for free when you solve the optimization problem using Gurobi or CPLEX. That's called the Locational Marginal Price (LMP), and it is the price that's actively traded. You can decompose the LMP in various ways.

The power on each transmission line is derived from the generation/demand at each location. One way of solving for them is using what are called "shift factors" (also called Power Transfer Distribution Factors). The idea behind shift factors is that while solving for the exact transmission flows is difficult, you can approximate them linearly. If you inject 1 MWh of power at one location and withdraw 1 MWh at another, that has a roughly linear impact on the transmission flows of each power line. The slope of that linear impact is the shift factor. You can purchase those from various vendors. There are other methods to compute flows, too.

Practical considerations

The first practical consideration is that the grid needs to exactly balance. But we're constantly flipping our light switch, turning a factory on/off, ramping up our generators and shutting them off.

The solution is called ancillary services. That's generation like batteries that can flip on at a moment's notice. It can also include demand that's quick to turn on, like a Bitcoin mine. There was discussion about using Bitcoin mines to help stabilize the Texas grid years ago.[26] Data centers might be another opportunity. Ancillary services get paid extra since they're so flexible.

Second, power plants need to know a little bit in advance if they're going to turn on. At a minimum, the day before a plant needs to know if their staff needs to come in. Ideally they'd have even more notice so they know when they need to procure fuel. That's where the "day-ahead" (DA) market comes into play, which is the most common market to trade. If you're used to other commodities, you might find this weird. This is a financial market that settles the day before any power is actually delivered. The ISO computes these prices the day before based on the offers and estimated demand that everyone submits.

Then, the day of, every five minutes we recompute an optimization that accounts for real-time constraints. That produces the real-time (RT) market price, and a lot of people like to trade it. The weather is the major factor that drives the RT market, since weather is the major factor that influences demand. When the weather is really hot or cold, people turn on their A/C or heater. Weather also impacts fuel prices like gas for the same reason.[27]

Finally, there are a bunch of other details that complicate this. Generators incur a cost if they've started up but don't produce power (called the no-load cost). There are minimum runtimes for many units. The list goes on. Note that the most complicated part of this problem is the part where generators are either on or off. That binary condition turns this from what's called a linear program to a mixed integer problem. As a result, people sometimes split the problem up. First figure out who's going to be running (unit commitment), and then determine how much each unit should produce (economic dispatch). Solving for unit commitment is a much harder problem.

Binding constraints

Consider a really simple two node example, where each node might represent a physical bus, a city, or other arbitrary region:

A ← (max 50 MW power line) → B

Imagine if A has marginal cost $100/MWh, and B has marginal cost $10/MWh. There's 10 MWh of demand at A. The production cost model will output the cheapest way to satisfy this demand: produce the 10 MWh at B and ship it over the power line to A. Therefore the price for power at A is $10. But notice what happens when there's 60 MWh of demand. At that point, B outputs as much as it can, but the power line gets saturated. The last 10 MWh of power must be supplied by the expensive unit at A for $100/MWh. The moment the power line hit its maximum capacity, the power price increased. That's called a "binding constraint." Those binding constraints are theoretically the core of what causes prices to increase.

I won't go into all the details of different production cost formulations, but this is enough to get you started. If you have a production cost model that outputs the price for a single day, you could compute the price for a three month forward strip by averaging your price estimate for each day across those three months. (Power is typically traded in strips like that - more on that later.) Sometimes if a major tech company is consuming significant amounts of power like for their data centers, they might lock in a price via the wholesale market through what's called "hedging." We will discuss hedging in a later section. Managing that hedge correctly can be profitable.

CHAPTER 09

Practical Approximations for Power Pricing

The production cost model has a lot of moving parts and tiny details. If you already know which units are running, then you can compute the result fairly easily. But the full version of the production cost problem also requires you to solve for unit commitments. That ends up being a combinatorially expensive problem to compute.

If you're forecasting the power price, you need to evaluate what the power price might look like under a variety of scenarios. For example, the exact level of demand depends on factors that we cannot predict perfectly, such as the weather. In addition, there might be generator outages or power lines that go down, and you want to know how the price will respond under those circumstances. If you're solving the full production cost model, it's not tenable to run thousands of scenarios, because it would take too long to compute each output.

The most common approximation that people make is to throw away the assumption that generators are fully "on" or "off." They allow solutions where a generator is "half on." That's called a continuous relaxation.[28] Aside from that basic trick, here are other common approximations that people make:

Exogenous interchange (flows)[29]

If you're solving for the zonal price somewhere like NP-15 in CAISO, you sort of already know what the flows will probably look like. You're going to import a few gigawatts from the PNW. If there's a lot of demand, you might even import from SP-15. If you know what the net exports look like, then you might simplify the balance to something like:

Supply = Net Demand + Net Storage

Predictable battery dynamics

In general, batteries are going to charge during the daytime then discharge in the evening. It's possible that in reality, a battery charges up a bit during the day, sells during the occasional daytime peak, but ultimately fully recharges before the evening when the power price spikes. But for the purpose of modeling the power price, the daytime price is basically close to $0. Capturing the variance there isn't really going to move the needle. We can simplify the whole setup: batteries charge during the daytime and discharge in the evening.[30]

Merit order dispatch

Once you have exports and storage fixed, now you just need to figure out the marginal cost of producing an additional unit of supply to meet demand. Create some estimate for demand (say, with linear regression on the temperature), sort the generators in your zone from cheapest to most expensive (called the "merit order") and figure out what's the marginal cost of the last unit required to dispatch. Due to marginal cost pricing, this is equivalent to solving for the market price.

Ignore or linearize losses[31]

Losses technically have a nonlinear relationship with respect to the power flowing on a transmission line. That's much harder for the computational solver, so you might instead just ignore losses altogether, or assume some fixed percentage of power is lost.

Risks

Where does this go wrong? Clearly, you can really screw up on the flows depending on the region you're trading. The flows are part of what makes power modeling so difficult. Some regions you can't get away without properly modeling this part. Obviously there are some details to batteries that we're missing.

There are tons of other precise details that the simplifications above do not capture. We didn't account for those startup costs which can heavily impact which units are actually dispatched. There's no reliability constraints accounted for. (Sometimes instead of importing power, a region is required to meet some amount of their demand locally.) We didn't really talk about demand modeling, accounting for behind-the-meter solar growth, new sources of demand like data centers or Bitcoin mines. But this simplified model isn't so far off from what a trader can actually use.

CHAPTER 10

Types of Power Trades

Whether you're a data center or a trader, you're probably wondering what's a normal way to interact with the power markets. It's common to define some set of hours as the "on-peak hours," which vary a bit by ISO[32]. They're more popular to trade than the off-peak hours because that's when there's the most demand.

Clearing and settlement

We briefly discussed the day-ahead (DA) market vs. the real-time (RT) market. You can trade on these markets via the relevant ISO. The DA market clears the day before, whereas the RT market is updated every 5 minutes throughout the day as power is consumed. These are both called "spot markets." Spot markets settle in the near-term.

The timing of these markets is a little bit confusing for the uninitiated. The DA market clears the day before power is generated and consumed. So if you're trading the DA for July 2nd, it's finished on July 1st. Everyone knows how much money they're owed or will receive. If you're a trader on the DA market, the story ends there. If you're a power plant and the next day you produce exactly what you locked in on the DA market, then you're going to get paid the DA price for that power.

One nuance is that sometimes power plants don't actually produce exactly what was anticipated. People consume a little bit more or less than what was anticipated. At the end of July 2nd, we know how much everyone actually bought and sold. The final settlement process will account for these differences. Any additional MWh consumed or produced will be settled at the RT price.

Hedging

A forward is a financial instrument that allows you to lock in the price of power for some future date. If you buy a forward on the DA market, it is financially settled; you receive or pay the difference between the eventual spot DA price and the price of your forward contract. Even if you've locked in a future power price using a forward contract, on the day that you consume power, you still need to buy that power off the spot market. So why does purchasing a forward strip help? This might seem basic, but I'll break it down for those who are unfamiliar.

The real issue with being a huge power consumer like an industrial plant is that the power price flies all over the place. One day you pay $75/MWh. Another day it's $30/MWh. You want to pay the same amount every day. Businesses need predictability.

Let's say you know you're going to consume about 300 MW of power continuously for the next year. The most straightforward thing to do is to go long 300 MW on a 1 year forward strip. Let's say it's $50/MWh. You think $50 is a pretty good deal. But there's no way to literally buy physical power in advance like that. Instead, what you'll do is create equivalent economic exposure. As each day-ahead market clears, you pay or receive the difference between the spot DA price and your forward contract price. Maybe it clears at $25/MWh on July 1st. Since you agreed to buy at $50/MWh, you lose $25/MWh on your hedge that day. But none of this actually buys you the power yet; it's just a forward contract on the DA price.

To consume power on July 2nd, you need to participate in the spot DA market on July 1st. So you'll purchase 300 MW of power on the DA market. The good news is that on July 2nd, when you actually consume power, you're only paying the power price of ~$25/MWh (with some caveats below), which is $25 cheaper than what you were prepared to pay. If you made money on your hedge (maybe the DA clears at $100), that profit will offset your higher cost later on the spot DA market. In both cases, you'll end up paying $50/MWh.

In reality, you're usually hedging using the average price over a zone, rather than the exact bus you're connected to, so there's some error. That's further complicated by the fact that your consumption might not exactly match up between the DA and RT markets. Another wrinkle is that the real-time optimization is a little bit different than the day-ahead optimization. It's also simpler in some ways, since they already know which units are committed. The good news is that there's this concept called virtual trading which allows participants to arbitrage differences between DA and RT prices, but we're not going to go into it.

Alternatively, let's say you own a natural gas power plant. You want to lock in your economics. The first thing you might think to do is go ahead and sell a forward strip on the power price to lock that in. But you're exposed to another risk: the natural gas price. If the natural gas price flies through the roof, suddenly you're not going to be so profitable. You reduce that risk by buying a forward strip on natural gas.

Congestion trading[33]

The simplest type of trade is similar to what I described above. You think the price for CAISO's NP-15 zone is going up, so you buy. That's called a directional trade. You might have your reasons for believing that. But there's often a better way to express it.

We've talked a little bit about what makes transmission interesting:

  • When a transmission line hits its limit, that's often what causes a price spike in a region.
  • In some regions, the flows are difficult to model correctly without a full production cost model, and even then, they are sensitive to various details.
  • The operator does not directly control flows. They are emergent values that result from generating power at various locations.

These properties mean that people often have extremely different views on what the flows will look like and whether a transmission line will be congested. A "basis" is the difference between two prices. In power pricing, a basis trade refers to buying the price at one location and selling the price at another. It implies you think the basis will increase - presumably due to a power line that suddenly hit its limit. Financial Transmission Rights (FTRs) are financial instruments whose payoff depends on the congestion between two nodes.

Spreads[34]

No discussion of power trading is complete without discussion of spreads, the terminology that power traders often use to discuss the market. Spreads are when you buy one instrument and sell another. The most popular spread is the "spark spread": buying a forward strip for power and selling a forward strip for natural gas. Sound familiar? That's exactly the spread a natural gas power plant sells to hedge itself.

The ratio of the gas vs. power position determines the specific spark spread purchased (or sold). For example, a power plant that is operating a 7 heat rate natural gas generator sells what is called a "7 heat-rate spark spread" to hedge itself. The dollar value of the spark spread is:

Power Price - (Heat Rate * Natural Gas Price)

There's also a "dark spread," which is the same concept applied to coal prices. That makes sense if you have some view on the profitability of coal plants, or if you're hedging your coal plant.

In a similar vein, sometimes people will look at the "effective heat rate" of a region: the implied heat rate of a natural gas unit that makes exactly $0 of profit under current market prices for gas and power. Traders use this to predict which natural gas generators are likely to turn on.

Last, there's the time-based spreads. You might buy one hour and sell another, or buy one month and sell another. There are many variations, but I'd argue spark spreads are the most relevant for data center/power plant operators.

CHAPTER 11

Meeting the Growing Power Demand

We started this primer talking about AI and increasing demand from data centers. That's how I want to end it.

Government responses

If you look at the news about data center legislation, it's mostly hesitant or hostile. Perhaps the most neutral example is the White House's Ratepayer Protection Pledge[35], which isn't a binding commitment, but a general alignment on the high-level intentions for how the White House would like to approach data centers. More extreme proposals include the Power for the People Act[36] in Congress, which has not seen much traction and calls for new rate classes, interconnection queues, and FERC rules. The summary of these attempts is to minimize the impact of data centers on ordinary electricity ratepayers.

The problem, as you can deduce, is that it's pretty difficult to untangle exactly what that impact is. In some cases, the cost for ratepayers has counterintuitively gone down, since those fixed costs like transmission/distribution are now shared with their new data center neighbors. In other cases, the data center can stabilize the daytime power price if it turns on during periods of low demand, like an ancillary service. In regions with high renewables presence, that can flatten the duck curve and make it economical for CCGTs to run all day, meaning lower evening prices for everyone. (As an exercise, you might try constructing a scenario where higher demand during the day results in a lower total sum of system cost throughout the day, depending on unit startup costs.) Remember that in Texas, wind turbines can drive the price negative when supply outstrips demand, harming the grid; by increasing demand, data centers in such regions can improve total welfare.

On the other hand, a data center built in the wrong location can congest the local transmission lines and cause those massive spikes that we've been worried about. The North American Electric Reliability Corporation (NERC) has warned that data centers can increase the prices in the resource adequacy/capacity markets[37] that we discussed.

The most extreme proposals have included moratoriums. Some of these moratoriums have failed; at least one has succeeded.

Separate grids

In some cases, like in New Hampshire, the local government has proposed an option for the data center to go "off-grid." Sometimes off-grid has different meanings, but in this case, the plant would literally be separated from the rest of the grid. That means they don't split the fixed costs, but it also means they don't drive up demand - at least directly. If the data center is a natural gas plant, they're still consuming natural gas. That impacts the regular grid, since the natural gas price is a little bit higher for everyone.

In some cases, you might see people talk about independent grids[38] or inference-first grids. They don't literally mean a physically disconnected grid. They mean having GPU clusters placed strategically around the world, wherever the power is the cheapest throughout the day. At any given time, people would send their jobs to the underutilized compute. That doesn't work for the training of machine learning models, which requires many GPUs to be co-located, commanding gigawatts of power in the same place. But inference, the usage of an already-trained machine learning model, does not have the same gigawatt-scale requirements. As a larger share of compute is spent on inference rather than training, there has been renewed interest in smaller wellheads and generators for this reason.

Propensity to buy

Based on various discussions, some major labs are comfortable with their level of power/compute a couple of years from now (2028). The real demand for power is now. The problem is that 6-12 months of demand isn't necessarily enough to underwrite the development of an entire plant. You'll remember that you need to underwrite years of cash flow in order to get a 9-figure loan, the size required to build a major new plant. The exact price for AI lab demand isn't always transparent, but we have a few estimates here and there.

SpaceX entered into this deal[39] to sell power to Reflection which offers high optionality: a 90-day out for either party. My napkin math indicates that this implies around ~$5000/MWh, but that's power that comes with GPUs ready to go. That said, no matter how you slice it, that's a lot of money. But the 90-day out makes it difficult to underwrite against.

A longer term structure is Anthropic's $19 billion lease with TeraWulf[40], which is 400 MW over 20 years starting in H2 2027. The implied revenue is ~$271/MWh with no GPUs included, but it does come with surrounding infrastructure like the building itself and cooling capacity.

I don't have any special information regarding what a major lab would pay for power under every possible permutation (lease lengths, start dates, with/without GPUs). The exact price indicates what type of generation is economical to reach for. Delaying the retirement of a coal plant comes with tremendous penalties: possible environmental consequences, expensive generation, carbon taxes. But even the least efficient unit on the grid becomes worthwhile when the demand justifies it.

What to do

It's clear that in the coming years, there is an incredible opportunity for those who can originate, finance, and operate power assets at scale.

But is the build of a new data center good or bad for local residents? Does it make sense to go construct a new temporary diesel plant to meet the 2026 power demand? Where are the biggest opportunities in the market?

Unsatisfyingly, it depends.

But now you're equipped to answer.

Footnotes